Modeling how a river will flood, or how the sea will rise over the shore, or how rain will accumulate and flood an area, is a tricky thing to do. The variables are limitless, and of course an act of nature is by definition unpredictable. Algorithms can get more and more complicated as these variables are accounted for in the model, but in the end it’s impossible to model things like trees accumulating under bridges to create ad hoc dams. What can really help a flood model’s quality is the foundation upon which it’s built: the empirical ingredients, like elevation data.
Upon encountering a new flood model, one of the immediately apparent attributes is how “fuzzy” it looks. The crispness of the model is a direct result of the resolution of the elevation data; in other words, how far apart on the ground are the elevation values. High resolution elevation data (10m/30’ and less) provides much crisper boundaries of the flood zones, while low resolution data (15m / 45’ and more) gets blurry and blotchy. Frequently, flood modelers need to compromise on the resolution of their elevation data because using very high resolution data (5m/15’ or less) requires a lot more processing power to produce the models.
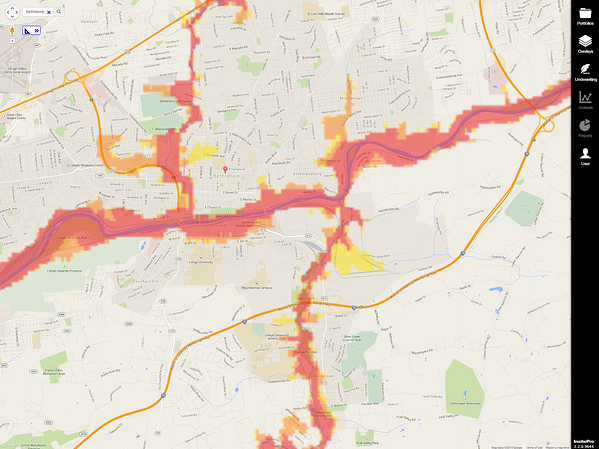
Low Resolution Flood Model: Intermap’s WorldFlood
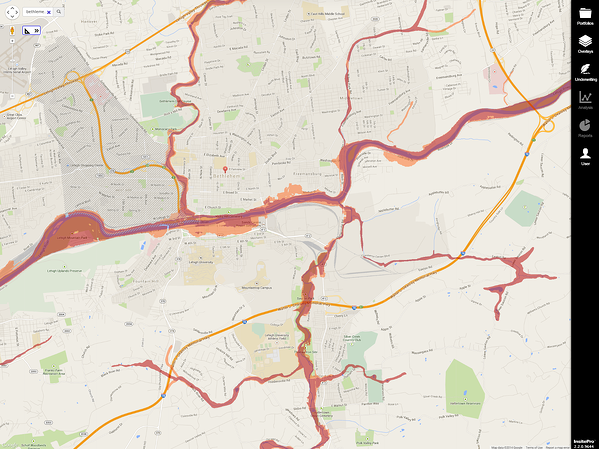
High Resolution Flood Model: FEMA FIRM
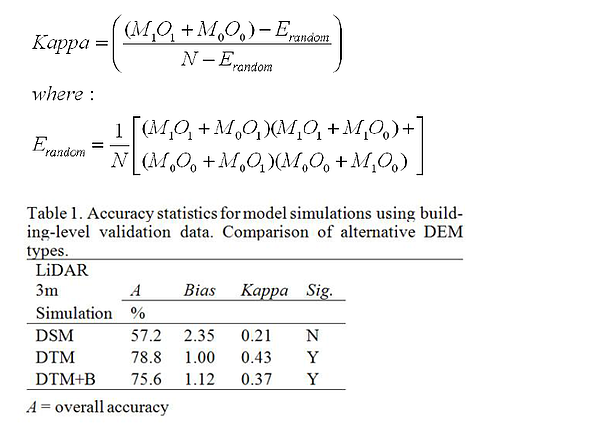
Another difference in the elevation data is whether it is a digital terrain model (DTM) or digital surface model (DSM). All elevation data starts as DSM, because the sensors used to measure elevation detect the first surface encountered, such as trees or buildings. DTMs, meanwhile, represent the surface of the bare earth — with trees, buildings, and other stuff removed through an editing process. DTMs vary in quality, too, as they can be created by automated edits (lower quality) or hand edits (higher quality). For flood modeling in general, DTMs are optimal because they best represent how the water will flow in reality. This might seem counterintuitive, as water does flow around structures, but by the time a flood is in full force the surface features have minimal impact on the flood event. Unfortunately, only a small proportion of the Earth’s land mass is mapped with DTMs (USA, Western Europe, large parts of S.E. Asia and certain areas in Australia). Here is some sophisticated science, courtesy of Ambiental Ltd (based in beautiful Brighton, East Sussex), supporting DTM’s superiority:
Beyond the elevation data, a flood model is greatly helped by information on the rivers themselves, including river-gauge data and historical flow information. This type of information is available in certain areas, with history going back 100 years or more. Of course, with some flood models predicting 1000 year floods, the historical record is short, but at least it is directly measured and this type of information does remove certain assumptions from the modeling process.
There are many ingredients in a flood model, and the ingredients used can be determined by a modeler based on what the model will be used for and resources available to create it. There are also many levels of quality for flood models, too, with different types of flood models suiting different purposes. Using robust empirical data in the model, regardless of the modeling methodology or purpose, will always improve the quality of a flood model.