
One of the most devastating forms of flood risk is coastal storm surge. The flooding is most intense at the shoreline, but surge flooding can affect locations 40 miles (65 km) from the coast. The amount of storm surge is dependent upon the size of the storm creating the surge, and the tide at the time of the surge. As building codes have improved, most damage caused by hurricanes is now due to the flooding associated with them — not wind damage. Some of the most devastating and expensive natural disasters in the USA have been largely due to storm surge, including Sandy and Katrina.
Given the destructive force of storm surge, it's obviously an important factor in the modeling of natural catastophes. In the United States, the National Oceanic and Atmospheric Administration (NOAA) publishes storm surge data with interesting names like SLOSH, MEOWs and MOMs. Let’s take a look at what this data is, and how it can be used.
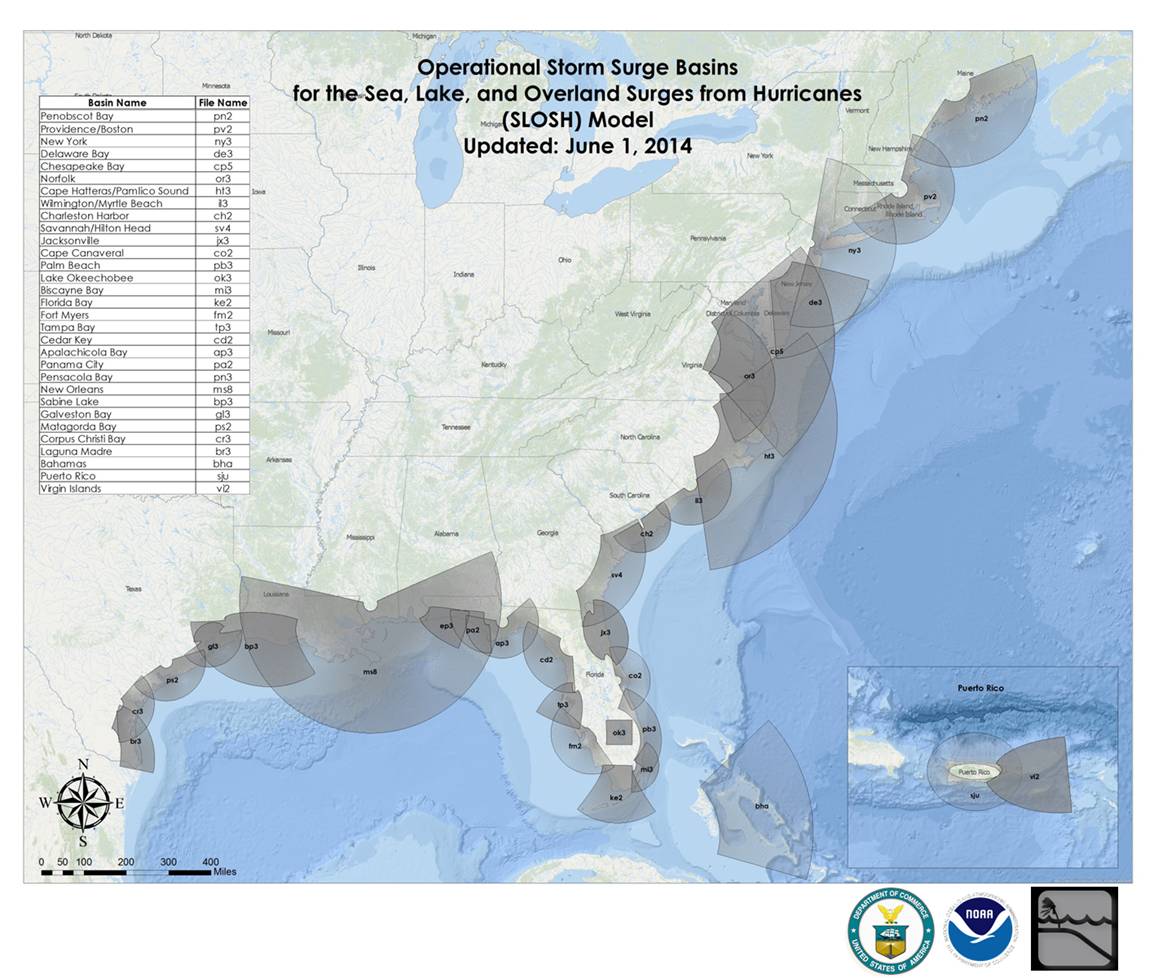
SLOSH (Sea, Lake, & Overland Surge from Hurricanes)
The fundamental modeling for storm surge is called the SLOSH model, a fantastic acronym for Sea, Lake & Overland Surge from Hurricanes. The National Weather Service (NWS) created these models to estimate the height of the surge waters at a given location. The term "height" can easily cause confusion here: height means the height of the top of the water above mean sea level (MSL). The SLOSHes are created from specific points on land in fan-shaped coverage areas, as shows in the SLOSH map below.
MEOW (Maximum Envelope of Water)
NOAA takes the SLOSH models and does some stochastic modeling to create a worst-case scenario dataset for disaster relief planning. The worst scenarios from the stochastic results results in the MEOW models, a charming acronym for Maximum Envelope of Water. The MEOWs are built for each SLOSH basin (or “fan”) to show the maximum likely extents of the surge flooding. They do not depict the likely flooding from any one storm, because they really are a composite of many possible storms. The MEOW models are handy for insurers to understand where surging water is likely, and unlikely, to cover.
MOM (Maximum of the MEOWs)
Finally, NOAA injects yet more pessimism (or conservatism) into the models by taking the Maximum of the MEOWs, to create the MOM models. The MOMs are the dataset most widely used for insurance purposes, as they represent the most conservative view of where surge water will reach.
The MOM data is still height information, but insurers care more about the depth of a surge wave at a given location. NOAA calculates depths by subtracting ground elevation from the surge heights in the MOMs, and makes these depths available freely. InsitePro also delivers depth information, but based on NEXTMap DTM instead of publically available elevation data. This offers the advantage of a unique view to its users.
With the SLOSH, MEOW, and MOM datasets, storm surge in the USA is well understood. Other regions do not have such robust public datasets, and many coasts around the world have nothing available but the hard history of actual flooding events. NOAA and the NWS should be proud of the datasets they’ve made, as well as of the acronyms they’ve named them with.