The Associated Press recently ran a story on new research that tries to ascertain the return period (or annual likelihood) of the 2013 Colorado floods. Here is a reminder from the Denver Post of what the flood was like; since it was over two years ago (it seems like yesterday!).
As any decent summary should, let’s start with the conclusion of the research: “…the best way to characterize this storm is a very unusually widespread 100-year event with some small pockets of a 500-year event thrown in there.”
A very unusually widespread event? A 100-year event, except where it was a 500-year event?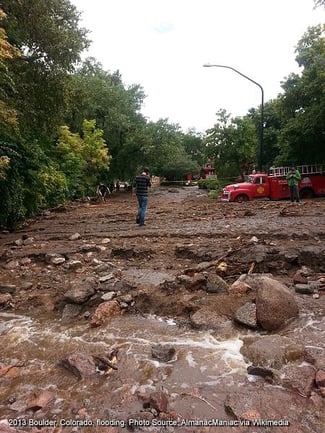
There are no flood models that show how widespread an event should be, nor how 1% events can be 0.2% events in places. It all sounds confusing.
This is not a flaw with the research – it is in fact a perfect illustration of the complexity inherent in determining the return period (or annual probability) of an event. The researchers need to estimate how a single event relates to a set of events extending back centuries for which we only have about 150 years of history. It should be expected that the results do not fit into the definitions and categories we expect to see and use in flood models, because flood models—like all models—are estimations based on empirical data and assumptions. That’s why they are all wrong (but some are useful).
How is an underwriter meant to interpret this research? Well, don’t worry: this information is not intended for insurance underwriting. The article lists those who will be impacted by this new data: local governments setting building regulations; waterway managers planning upgrades of urban and suburban waterway infrastructure; and homeowners and mortgage suppliers determining who needs flood insurance. For these purposes, the new Flood Insurance Rate Maps (FIRMs) will be well suited and very useful.
That last use case, though, is the interesting one. This new data will inevitably find its way into FEMA’s FIRMs, and will dictate who needs to purchase flood insurance. The updated FIRMs will also set the NFIP pricing for homes newly identified to be in the 1% flood zones. But, the updated flood maps from FEMA will not be useful for underwriting private flood (those who administer NFIP policies need nothing beyond the FIRMs). Underwriters of actuarial-based, privately-backed flood insurance need better information than the FIRMs are able to convey, because the FIRMs use broad strokes to estimate the areas vulnerable to 1% floods. They don’t help understand the risk of flood at a specific property.
To illustrate this, imagine an underwriter of private flood using the future FIRMs, knowing the property is located in a 1% flood zone based on an unusually widespread event, and it has a chance of being in a 0.2% zone that coincided with the 1% event in 2013. The property is lumped in with everything around it, and the flood risk at that location is not specified, or even usefully estimated. This is underwriting with a paint roller.
Instead of a paint roller, underwriters need a pen. They need to be able to evaluate the flood risk at a specific property, and they need to use as much information (including elevation data, geospatial data, alternate flood models, claims history, and more) at that specific location to evaluate it. And, they can use the FIRMs if they want to include the FEMA rating in their evaluation. But, remember: flood rate maps are not an underwriting tool – configurable risk scoring is.