Earlier this year, we introduced the concept of the butterfly chart at the Risks of Hazard.  To quickly summarize what the butterfly chart is, there are two distinct opportunities for underwriters to grow flood premium each forms a wing of the butterfly.
In the chart, the horizontal axis is Flood Risk (low to high), and the vertical axis is normalized cost/price.
The red line is the normalized premium collected, and is especially representative of premium collected by the NFIP in the SFHA. Notice how flat it is – the premium collected is almost independent of risk. This is “underwriting with a paint-roller”, with the premium spread like paint over the whole flood prone area. The yellow line depicts an underwriter’s ability to rate every risk, based on the risk.
The left-side wing of opportunity is cherry-picking: charging less premium than the NFIP for risks that are lower than what the NFIP’s pricing indicates. This wing represents the majority of private flood coverage in the US thus far.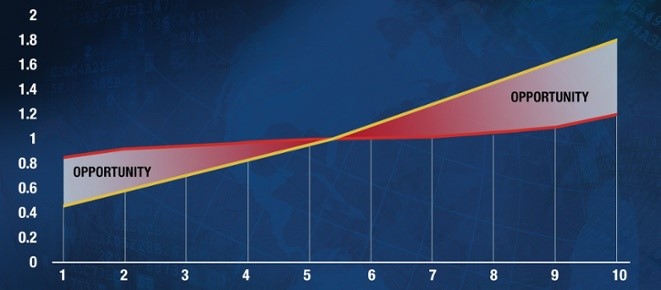
The right-side wing of opportunity is largely comprised of the protection gap. While high-risk locations in the SFHA are covered by the NFIP (at unsustainably low rates), there are LOTS of uninsured properties that need flood insurance. The opportunity for underwriters is to charge higher rates for these risks, while competing on better conditions (deductable, limits, service, etc.). The right-side opportunity is harder to unlock, but with much less competition and more potential premium and profitability.
The reason we are blogging about the butterfly again is that this week we are seeing a group of underwriters alter their approach to the US Flood market by leveraging configurable analytics and pursuing that right-side opportunity. And it is very exciting because we at the blog have been advocating that underwriters have access to immense opportunity in the US flood protection gap, and this week is a validation of our advocacy.
The butterfly has landed, and it brings opportunity to the underwriters ready to chase it.