Today is a big day for Intermap and for InsitePro — we are releasing FloodScope™ USA, the only flood model available that is built on a contiguous, manually-edited digital terrain model (DTM) for the lower 48 states and Hawaii.
As I've discussed before, elevation data is a key input into any flood model, so the ability to leverage a high quality DTM at full resolution is a significant achievement. Starting today, insurers can use flood zone determinations as a part of their analytics to better understand the risk of river flooding.
Below is a brief overview of what FloodScope is and how it can be used. (However, I can't share too much information yet because there is a pending patent on the process.)
Input Datasets
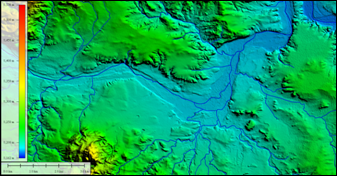
There are two main input datasets used in this new flood modeling process: elevation data and river locations. FloodScope uses the high resolution version of the National Hydrography Dataset (NHD) to locate the river centerlines, water body shores, and the watershed boundaries throughout the modeled area. This dataset is the most comprehensive catalog of water locations available. For elevation data, we are naturally using NEXTMap® USA DTM — Intermap's proprietary elevation dataset posted at 5m sample spacing for the whole country. The elevation data was acquired using our own fleet of aircraft equipped with Interferometric Synthetic Aperture Radar (IFSAR or InSAR), with all the surface features (buildings, trees, etc.) removed through a hand-edited production process.
Process
The process is too boring for a blog.
Outputs
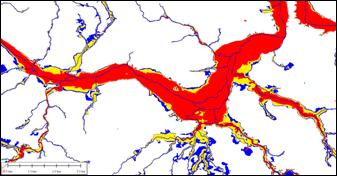
The output for FloodScope is exciting. We are producing flood return periods of 20 years, 100 years, and 500 years (or 5%, 1%, and 0.2% annual chance of flooding). Depths of flooding are also predicted by the model. The FloodScope zones for the return periods show a strong correlation to reliable and accurate geospatial information, and the validation work we have conducted has been very satisfactory.
For a more technical exploration of FloodScope, including methodology and validation of the results, please download our white paper.
For a non-technical view, here is a look at the flood zones compared to their input DTM and river centerlines (red = RTP 20 years, yellow = RTP 100 years, blue = RTP 500 years) for a stretch of the Canadian River.
Using FloodScope
InsitePro is built on a philosophy that accepts the fact that there are limitations to all models, and aims to improve understanding of risk by combining different models and different types of data with configurable risk scoring. Risk can’t be known for certain, but uncertainty can be reduced and confidence can be increased.
With FloodScope, InsitePro has a new and very useful component for a flood risk score. It offers the ability to perform a correlation analysis with FEMA flood zones, a second opinion on other flood zones, and an independent flood model that can be combined with other types of data such as elevation data, hydrographical data, claims data, or other spatial data. FloodScope is only available by subscription to InsitePro and is available right now.