Two weeks ago, we published a post on how analytics aren’t so smart after all. It has been a sensation (only our Cat Modeler’s Guide to the Protection Gap has been read more this year), so it is only natural that we pursue the topic further.
The blog that lit up a little corner of the web was about the limitations of analytics, specifically flood risk analytics. It turns out there is some interesting science and folklore about the topic, so let’s take a look.
Analytics are an attempt to measure an immeasurable phenomenon. Cat risk analytics (flood, quake, hail, etc.) are perfect examples, as they aspire to determine the chance of something happening in a given location during a given timeframe – it is not possible. However, by evaluating a combination of different types of information, they can begin to produce results that are useful for underwriters who need those unknowable answers.
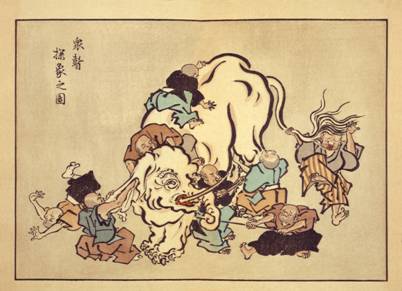
 The nature of analytics is portrayed in the Indian folk-tale of the blind men and an elephant. The story goes that a group of blind men are all trying to figure out what an elephant is by touching it, but each only feels a part of the elephant. One man declares that elephants are like tree trunks, another declares that elephants are smooth curved horns, the third is certain that an elephant is a flag made out of leather, and another tries to convince them that an elephant is actually a long and heavy hose. They each depend too much on a limited ability to perceive the full nature of the elephant. Just like an underwriter trying to get flood risk information from a FIRM.
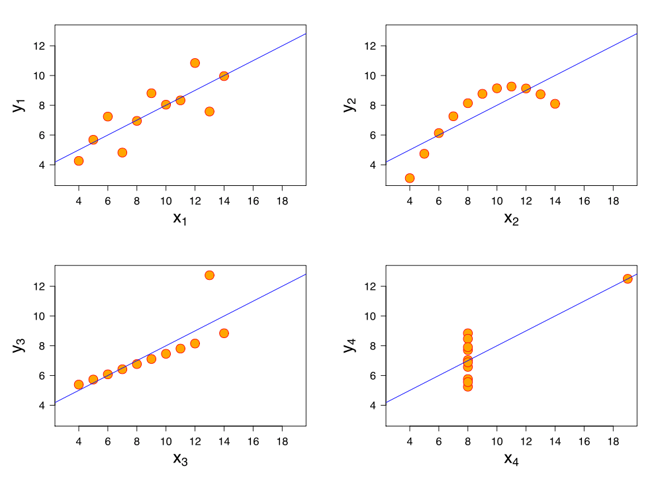
For those with a more scientific inclination, below is Anscombe’s Quartet. In 1973, the English statistician Frank Anscombe created a collection of four Cartesian datasets that had equivalent means of X, means of Y, variances of X, variances of Y, correlations, and linear regressions. What’s so peculiar about that? Check out the datasets.

Statistically speaking, they all share equivalent defining traits. Graphically, they are completely different from each other. Anscombe created this quartet to illustrate the importance of graphing data for evaluation instead of depending on the stats, but it also illustrates the fallacy of depending too much on analytics.
Anscombe’s lessons for cat underwriters might include the importance of looking at a risk on a map, and using as many different datasets as possible (there is no Anscombe’s Quartet). Actuaries and accumulation folks should also take note of the great influence of the outliers in the third and fourth sets. But the most important lesson is that underwriters need to understand their analytics, especially the weaknesses. Writing flood risk based on return periods from a single flood map is much like depending on the statistics to evaluate the Quartet – it looks right and makes sense, but it’s deeply flawed.
Since all folk tales, and most mathematical theorems, have a moral, let’s go with: Don’t be a blind underwriter using a few stats to build a portfolio – goodness knows what you’ll be left holding.

